Hazard-conditioned planning
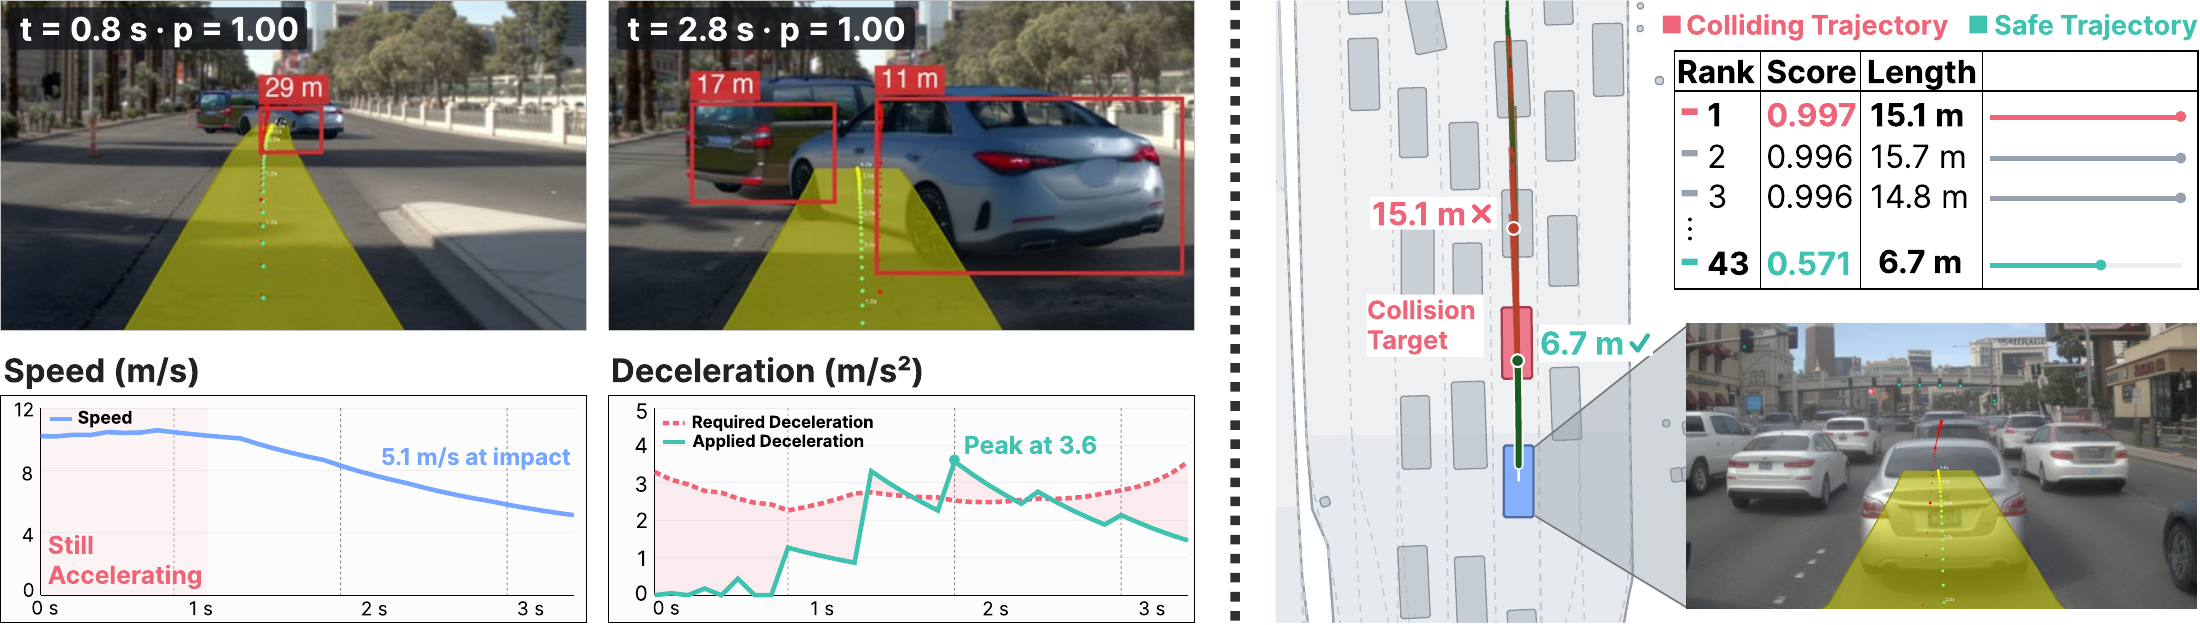
LTF detects crossing traffic at 29 m but continues accelerating and brakes too late. The observed plan remains consistent with routine car following despite the crossing conflict.
Closed-loop driving safety benchmark
1UCLA · 2UCSD · 3Toyota Research Institute
*Equal contribution; order by last name †Corresponding authors
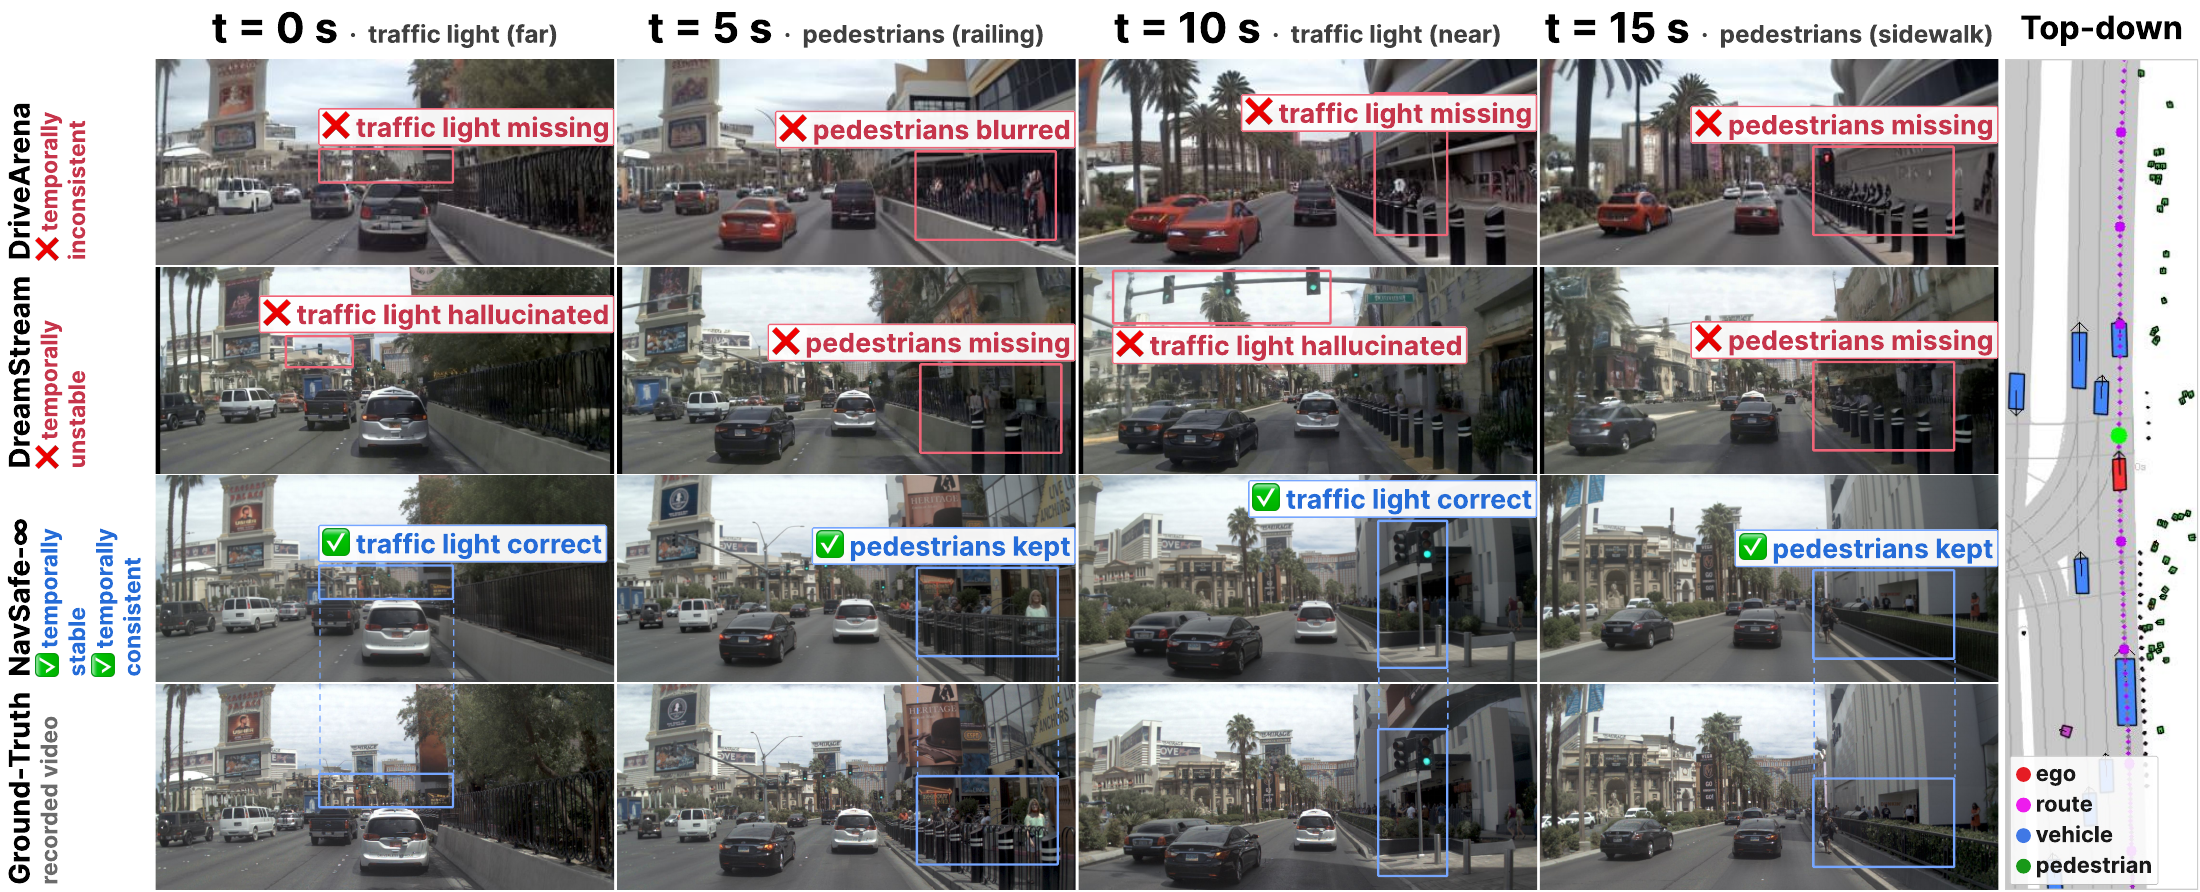
Photorealistic reconstructions of nuPlan scenes, front camera.
Event-based evaluation in photorealistic closed-loop environments.
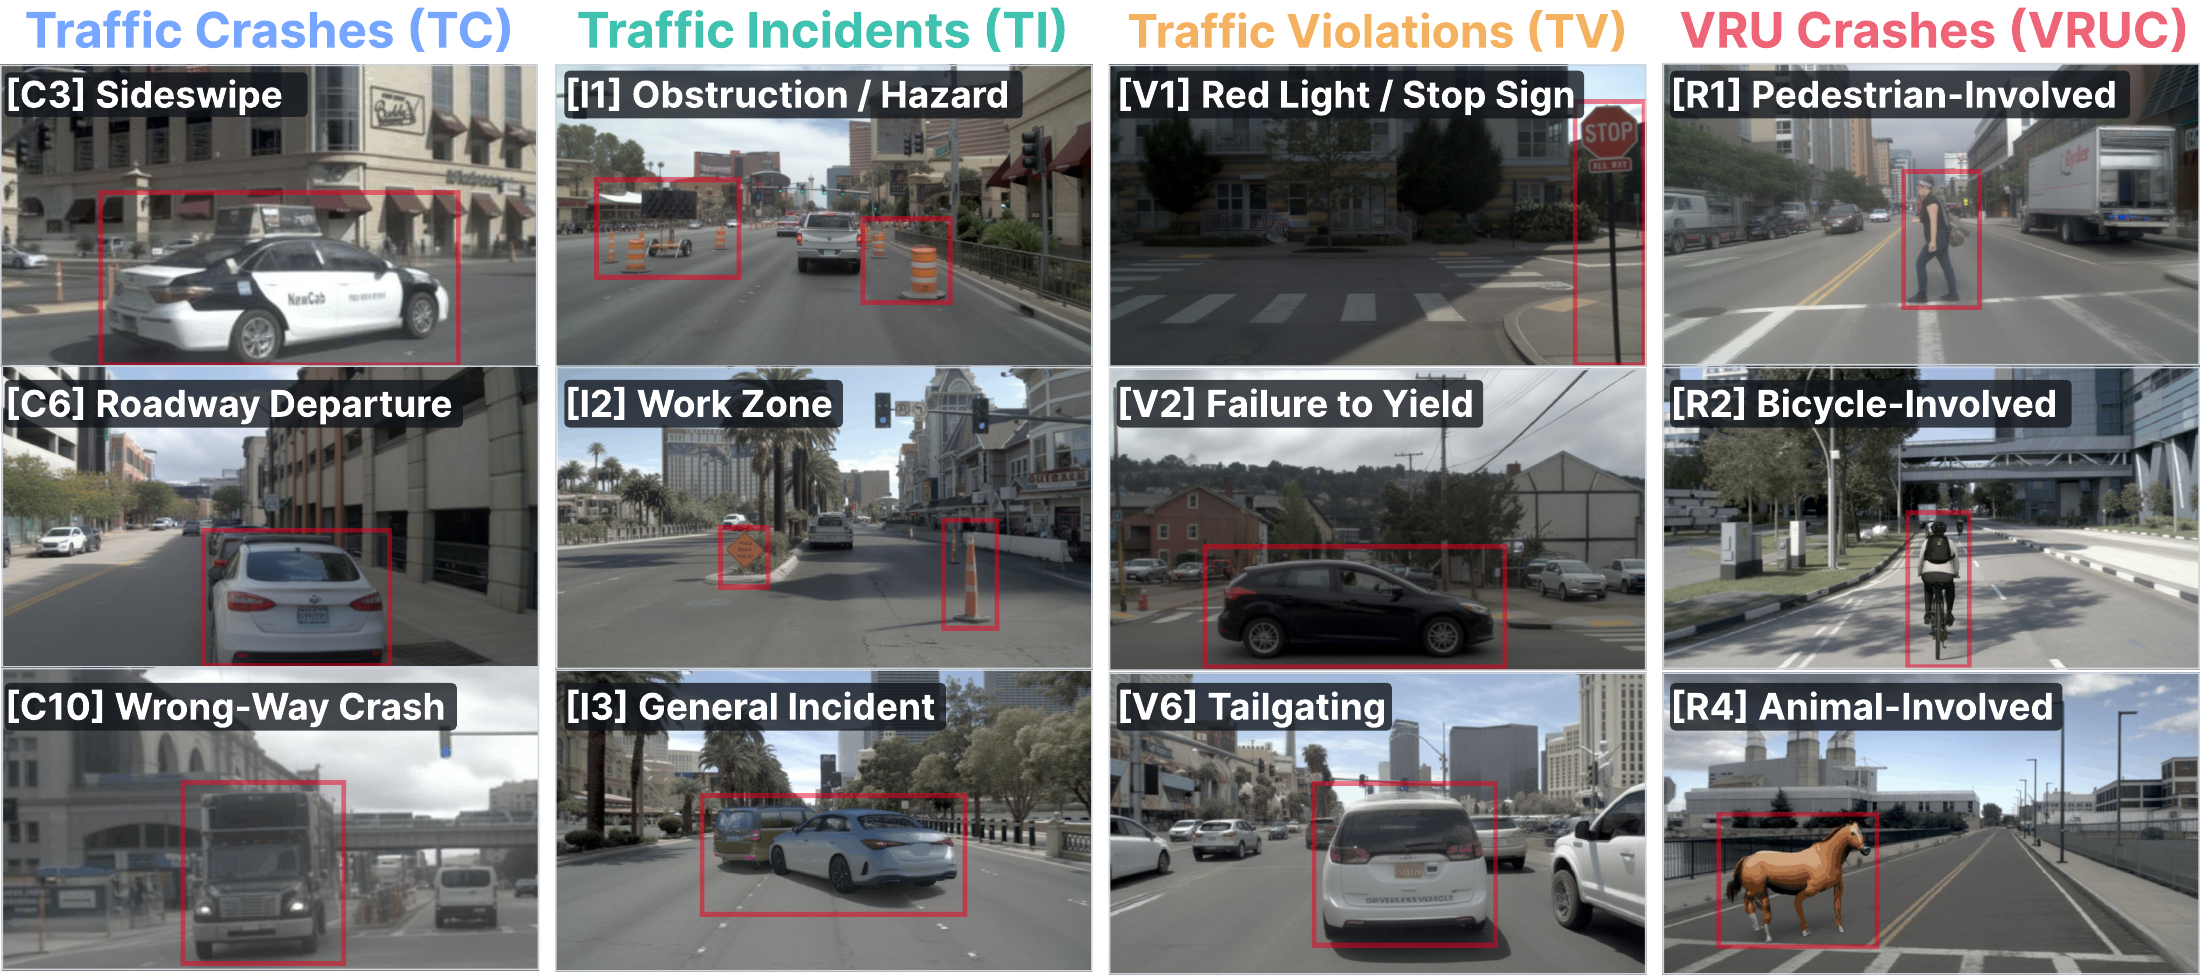
NavSafe evaluates 280 event-based scenarios across 28 event types, adapted from RoadSafe365. Each bounded scenario isolates a safety capability while preserving the feedback between a policy and its environment.
Respond to vehicle conflicts and collision hazards.
Resolve work zones, obstructions, and unexpected conflicts.
Follow traffic controls and event-specific rules.
Yield to pedestrians and other vulnerable road users.
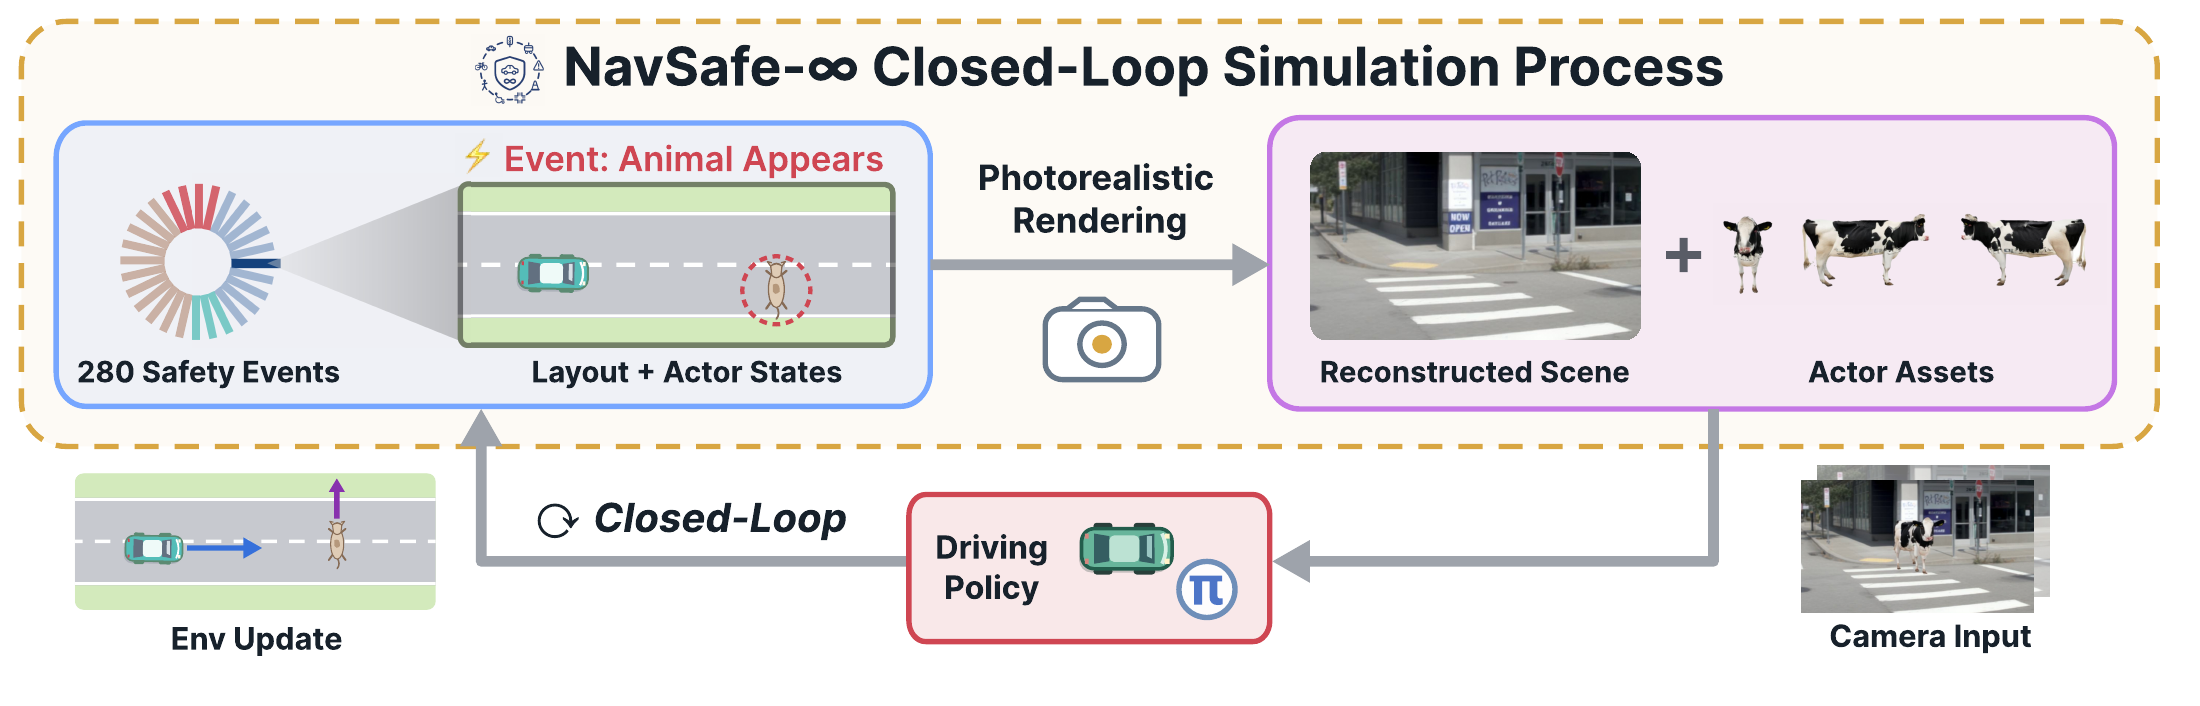
The renderer produces camera observations from the current ego and actor states. The policy proposes a plan, the simulator advances, and the next observation reflects the consequences. Reconstructed 3D scenes support configurable camera rigs and controlled edits to traffic elements and actor behavior.
Driving score (DS)Event progress multiplied by infraction penalties, scaled to 0–100.
Success rate (SR)Events completed within the time budget without a disallowed infraction.
Driving efficiency (DE)Ego speed relative to surrounding traffic.
ComfortCompliance with acceleration, jerk, yaw-rate, and yaw-acceleration bounds.
Category ability scores are the unweighted mean of event-type success rates within TC, VRUC, TV, and TI.
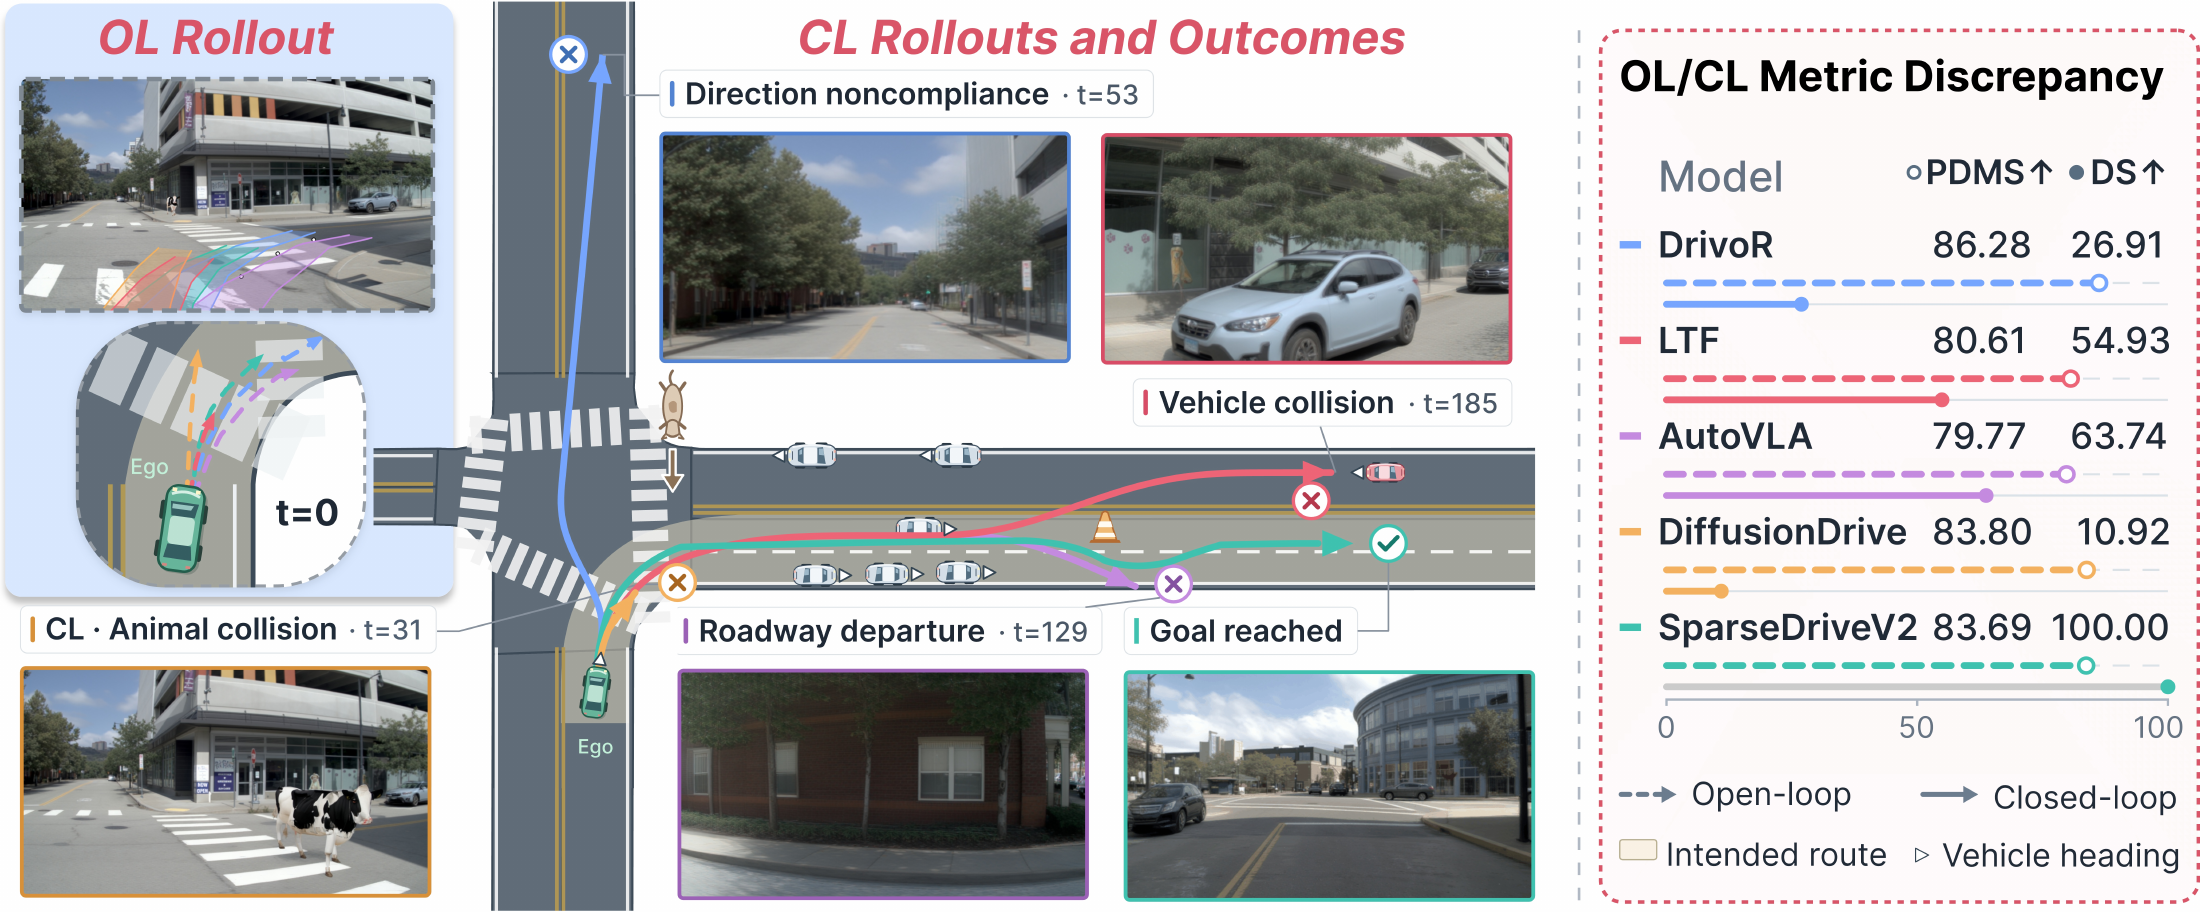
Strong open-loop performance does not guarantee closed-loop safety.
The best learned policy reaches 61.79% success, compared with 81.31% for the privileged PDM-Closed reference. No learned policy leads all four safety categories.
Section 4.1 main-table results · 280 scenarios · 3 seeds (0, 1, 1024). Values are mean ± sample standard deviation. Select a metric heading to sort; the human reference remains first, followed by the privileged reference and learned policies.
| Policy | Venue | ||||||||
|---|---|---|---|---|---|---|---|---|---|
| Human Driver ReferenceReference | -- | 100.00± 0.00 | 100.00± 0.00 | 316.52± 0.42 | 75.15± 1.89 | 100.00± 0.00 | 100.00± 0.00 | 100.00± 0.00 | 100.00± 0.00 |
| PDM-ClosedPrivileged reference | CoRL 2023 | 90.17± 1.00 | 81.31± 1.03 | 305.27± 8.57 | 82.49± 1.39 | 88.67± 1.53 | 72.50± 0.00 | 84.24± 1.39 | 57.78± 1.92 |
| GTRS-Dense-V2-99 (SimScale)Passive Demonstration Perturbation Methods | CVPR 2026 | 73.54± 0.84 | 61.79± 1.56 | 141.50± 1.30 | 87.69± 1.66 | 69.33± 0.58 | 50.00± 2.50 | 64.24± 1.89 | 43.33± 3.33 |
| SparseDriveV2IL-based Methods | ECCV 2026 | 65.26± 1.72 | 48.81± 3.04 | 167.99± 1.01 | 93.41± 0.43 | 54.00± 0.00 | 43.33± 8.04 | 48.18± 4.17 | 41.11± 3.85 |
| DrivoRIL-based Methods | CVPR 2026 | 64.74± 1.60 | 50.71± 0.71 | 188.02± 1.07 | 87.92± 1.25 | 58.67± 2.52 | 31.67± 5.77 | 52.42± 2.62 | 43.33± 0.00 |
| GTRS-Dense-V2-99IL-based Methods | arXiv 2025 | 64.27± 0.76 | 49.52± 1.15 | 163.88± 0.87 | 95.90± 0.63 | 52.00± 1.73 | 40.00± 2.50 | 54.24± 0.52 | 36.67± 0.00 |
| DrivoR (SimScale)Passive Demonstration Perturbation Methods | CVPR 2026 | 57.66± 1.32 | 42.50± 0.36 | 176.73± 0.92 | 85.88± 0.39 | 44.00± 1.00 | 17.50± 2.50 | 48.18± 2.41 | 50.00± 0.00 |
| SimWAMWorld-Model-based Methods | arXiv 2026 | 57.53± 2.72 | 37.50± 1.56 | 160.54± 1.64 | 97.19± 0.27 | 41.33± 0.58 | 26.67± 7.22 | 40.61± 0.52 | 27.78± 5.09 |
| MTDrive-mtGRPORLFT-based Methods | arXiv 2026 | 55.86± 0.50 | 40.60± 0.90 | 277.62± 3.17 | 93.94± 0.41 | 40.33± 2.89 | 16.67± 1.44 | 46.36± 0.91 | 52.22± 3.85 |
| ReCogDrive-2B-RLRLFT-based Methods | ICLR 2026 | 53.64± 1.42 | 30.95± 2.06 | 173.96± 1.90 | 85.10± 0.49 | 35.33± 2.31 | 18.33± 6.29 | 32.42± 1.39 | 27.78± 5.09 |
| LTFIL-based Methods | NeurIPS 2024 | 53.04± 1.92 | 27.74± 1.76 | 163.71± 0.11 | 97.81± 0.15 | 31.67± 0.58 | 25.00± 7.50 | 28.48± 1.89 | 15.56± 1.92 |
| LTF (SimScale)Passive Demonstration Perturbation Methods | CVPR 2026 | 52.65± 0.88 | 34.05± 0.21 | 192.09± 0.85 | 97.41± 0.48 | 35.00± 1.73 | 17.50± 2.50 | 38.48± 0.52 | 36.67± 0.00 |
| DiffusionDrive (SimScale)Passive Demonstration Perturbation Methods | CVPR 2026 | 52.19± 2.05 | 35.24± 2.38 | 189.66± 4.28 | 96.92± 0.34 | 38.33± 1.15 | 18.33± 7.22 | 36.67± 5.01 | 42.22± 3.85 |
| AutoVLARLFT-based Methods | NeurIPS 2025 | 51.05± 0.80 | 29.52± 2.43 | 186.02± 0.58 | 65.37± 0.47 | 33.00± 2.65 | 15.00± 4.33 | 29.70± 2.92 | 36.67± 8.82 |
| ReCogDrive-2B-ILIL-based Methods | ICLR 2026 | 48.98± 0.95 | 28.21± 1.43 | 166.94± 3.15 | 97.58± 0.11 | 30.00± 1.00 | 16.67± 3.82 | 31.21± 0.52 | 26.67± 3.33 |
| MTDrive-SFTIL-based Methods | arXiv 2026 | 48.78± 0.88 | 31.79± 1.43 | 173.77± 0.76 | 94.51± 1.25 | 30.33± 1.15 | 15.00± 6.61 | 35.76± 1.39 | 44.44± 1.92 |
| RAPIL-based Methods | ICLR 2026 | 47.70± 0.66 | 27.26± 0.41 | 220.78± 3.77 | 48.38± 0.60 | 32.33± 1.15 | 14.17± 6.29 | 28.79± 0.52 | 22.22± 3.85 |
| DiffusionDrive (BeyondDrive)Passive Demonstration Perturbation Methods | ECCV 2026 | 46.61± 0.07 | 21.79± 0.94 | 172.79± 1.26 | 97.24± 0.19 | 22.67± 1.53 | 10.00± 0.00 | 25.15± 1.39 | 22.22± 1.92 |
| DiffusionDriveIL-based Methods | CVPR 2025 | 44.77± 0.75 | 20.95± 0.55 | 165.08± 1.84 | 97.68± 0.56 | 21.33± 1.15 | 11.67± 1.44 | 23.64± 0.00 | 22.22± 1.92 |
19 policies and references
Human Driver Reference is the paper’s hybrid upper reference using front-camera observations. PDM-Closed is privileged and non-learned; neither is ranked against learned policies. DE is a relative-speed measure and can exceed 100.
We investigate how driving policies fail in closed-loop execution and why common training remedies do not consistently improve safety.
LTF detects crossing traffic at 29 m but continues accelerating and brakes too late. The observed plan remains consistent with routine car following despite the crossing conflict.
DrivoR executes its top-ranked trajectory and collides with the lead vehicle. A safe stopping trajectory exists in the candidate set, but is ranked 43rd.
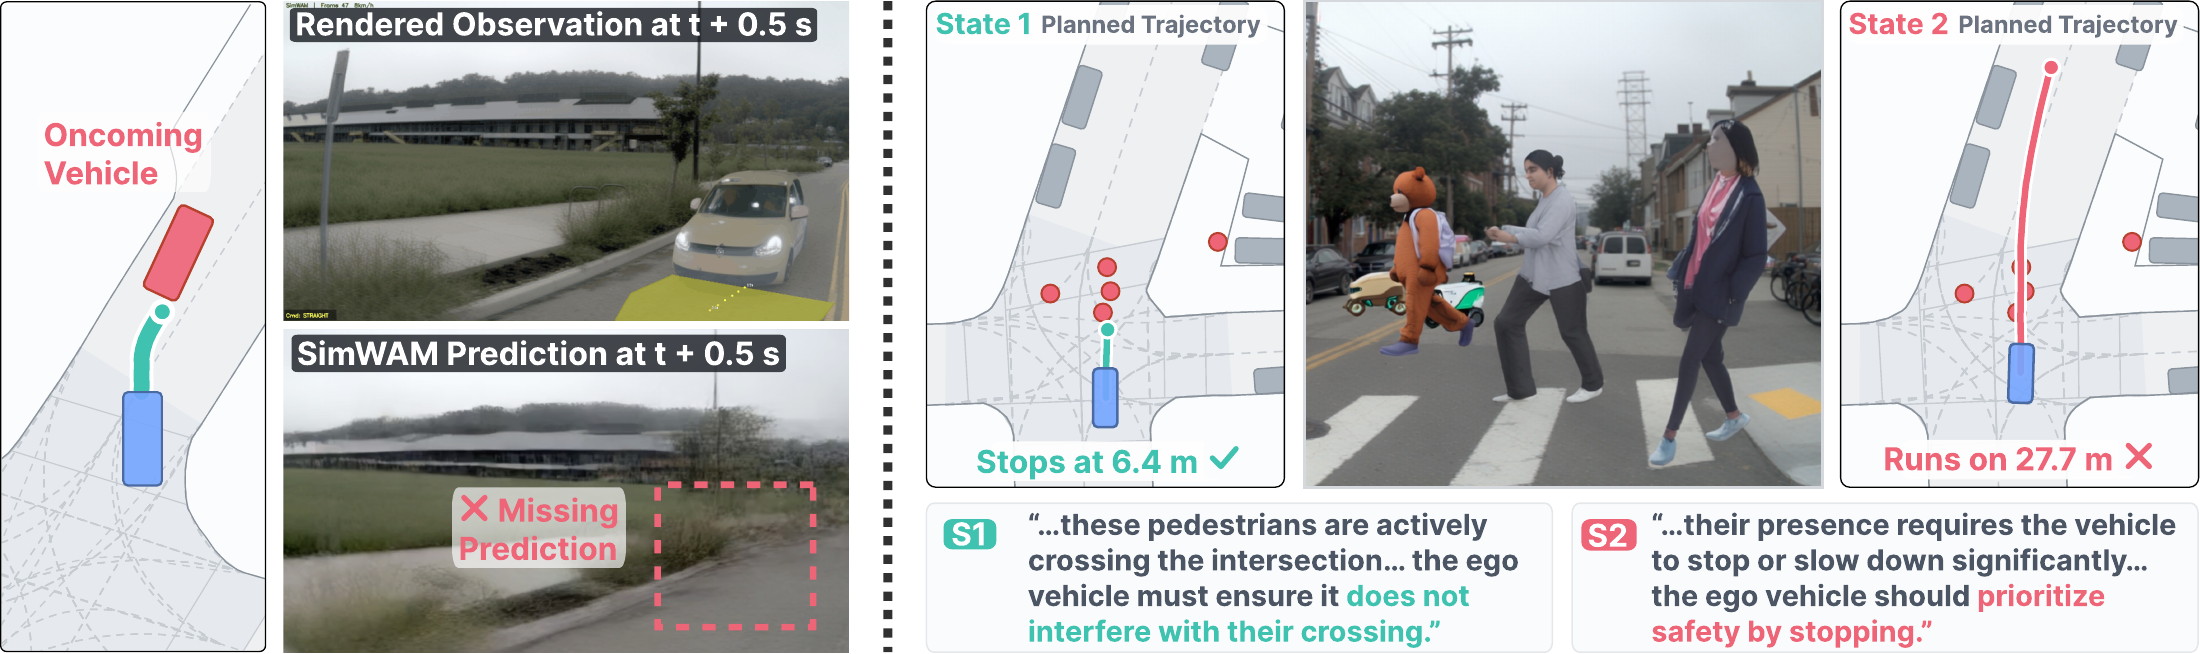
SimWAM omits an oncoming vehicle from its future prediction and plans through the space it occupies, removing a safety-critical constraint.
At the same instant in two policy-induced states, AutoVLA identifies crossing pedestrians and calls for stopping. Only one decoded trajectory realizes that decision.
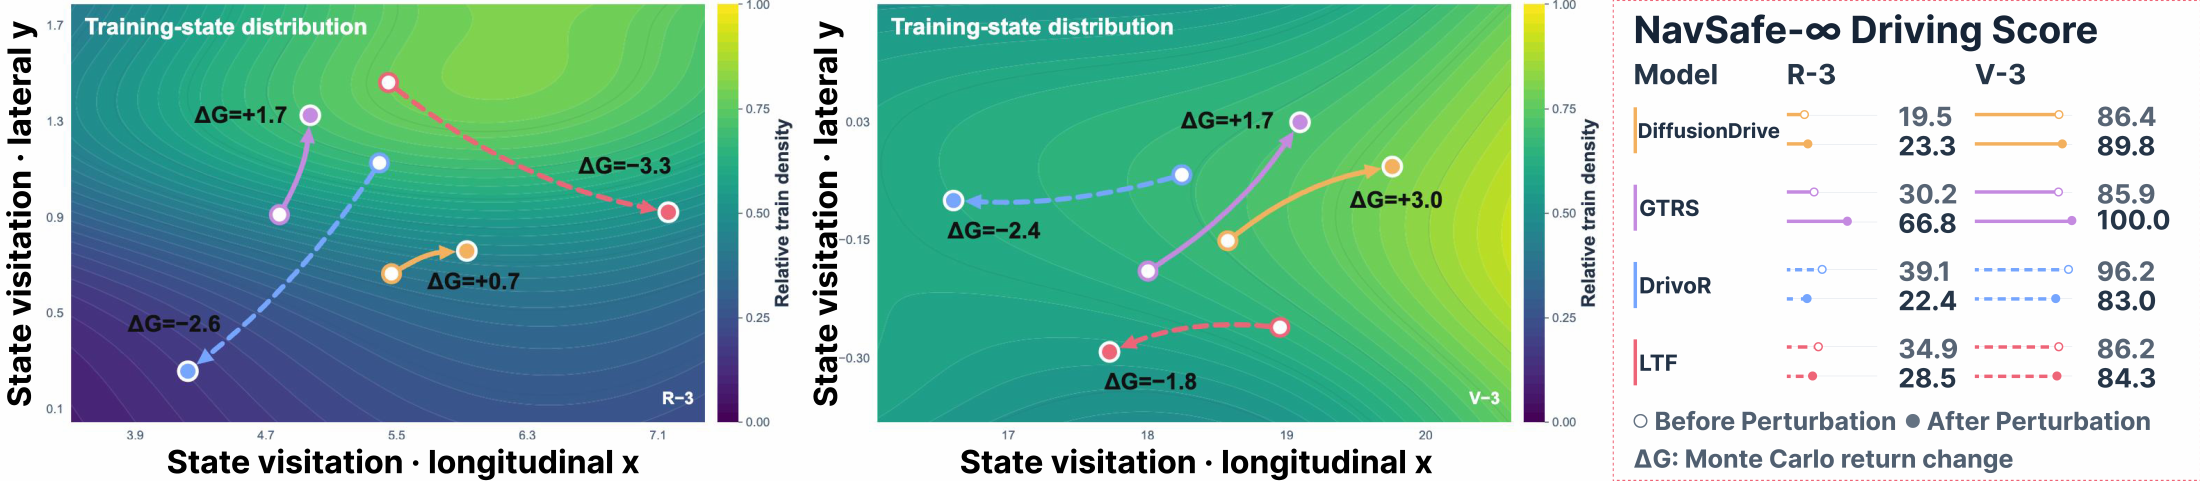
Passive perturbation pairs perturbed ego states with expert recovery trajectories. Its effectiveness depends on whether closed-loop rollouts remain covered by the perturbed state distribution. Because these demonstrations are generated independently of the policy, they may miss the states visited during execution.
Anchor-based policies (DiffusionDrive and GTRS) retain stable, expert-like candidates; training mainly improves scoring and keeps rollouts closer to the perturbed distribution. Query-based policies (DrivoR and LTF) improve open-loop scores but still drift beyond that distribution. The figure diagnoses this gap through state shifts and Monte Carlo returns, complementing the benchmark success rates below.
DiffusionDrive + SimScaleSuccess rate: 20.95% → 35.24%▲ 14.29
DrivoR + SimScaleSuccess rate: 50.71% → 42.50%▼ 8.21
LTF + SimScaleSuccess rate: 27.74% → 34.05%▲ 6.31
GTRS-Dense-V2-99 + SimScaleSuccess rate: 49.52% → 61.79%▲ 12.27
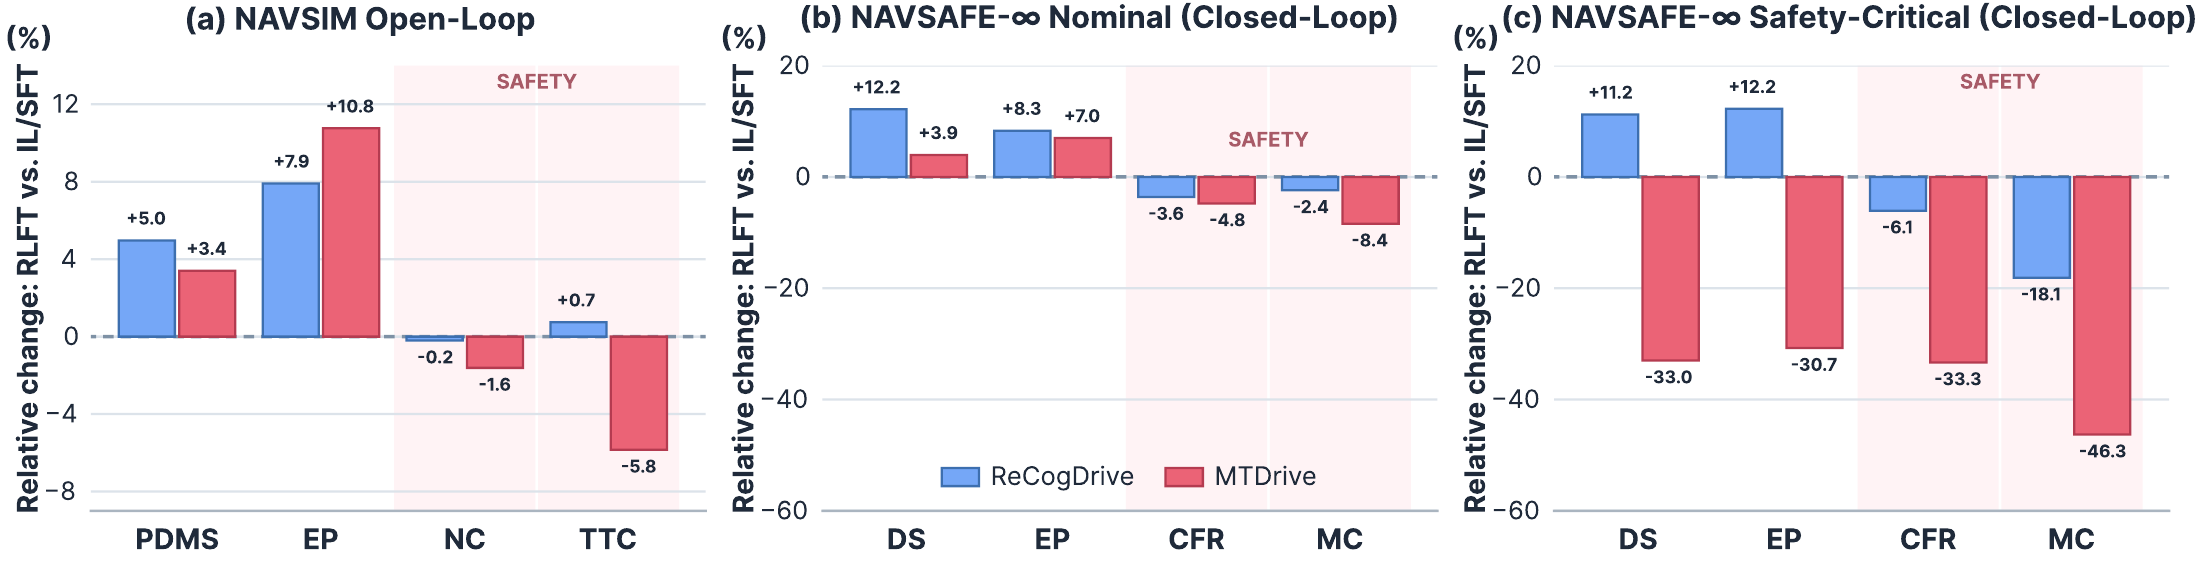
RLFT scores trajectories against a frozen logged future. Because the proxy rewards progress more directly than safety margin, open-loop reward gains can come at the expense of safety. Repeated closed-loop replanning compounds this risk, with collisions ending safety-critical rollouts early.
ReCogDrive largely preserves safety-related scores, allowing gains to transfer. MTDrive gains progress at the cost of safety, reducing driving scores in the safety-critical diagnostics shown below. These diagnostics are distinct from the aggregate leaderboard.